Regular Investment
Ongoing investments are the most common investment products available to retail clients. They are recommended with a sufficiently long investment horizon for risk assets, such as equity funds. What is a sufficiently long investment horizon? Does it matter when to start with an investment? And what are the real annual incomes including inflation calculation? These are the questions this article tries to answer.
For our modeling needs, we focused on the main American stock market index SP500 that is perhaps the only index with adequate history for serious research. The inflation adjusted data related to the index are downloaded from the server www.multpl.com. Whereas the investments are often sold to clients as an inflation protection, we consider the use of adjusted data as the correct way for research.
Graph 1: Development of 17.6-year cycle and the SP500 index 1911-2012
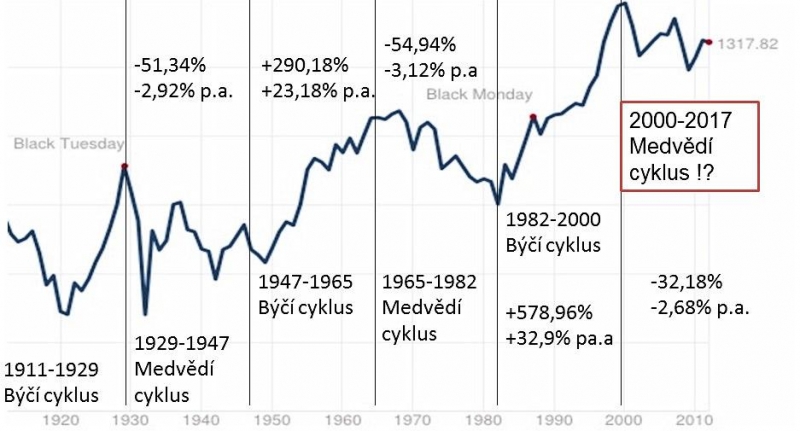
It is not just our opinion, that 17.6 year cycle is the dominant cycle, managing the development of the share price over the past more than one hundred years. Cycles come and go away and we are aware that the cycle influence may have limited duration and may not be valid in the future. Nevertheless, we decided to take it as a basis for further consideration.
The results of lump-sum investments made at the beginning of each cycle are shown in the first graph. We use only inflation adjusted numbers and values of indexes. We believe that this cycle affects also the results of ongoing investments.
The advantage of regular investments is that it can in sufficiently long investment period efface disparities caused by cyclical movements of the stock market. When investor receives more shares for the same amount during the market downturn, then subsequently during the market turnover upwards this cheaply acquired capital is appropriately utilized. Due to the length of the cycle, it is clear that if the investor decides for regular investing at the beginning of the bear cycle and chooses insufficiently long time horizon, he will not be able to benefit from the investment. For example, when entering the market in 1965 with five or ten-year horizon, it is obvious that still declining stocks did not allow to profit from the increasing number of purchased shares. Cheap purchases began to yield before the beginning of the bull cycle.
Figure 2: Return on continuous investment for 15 years with the beginning in the bear cycle
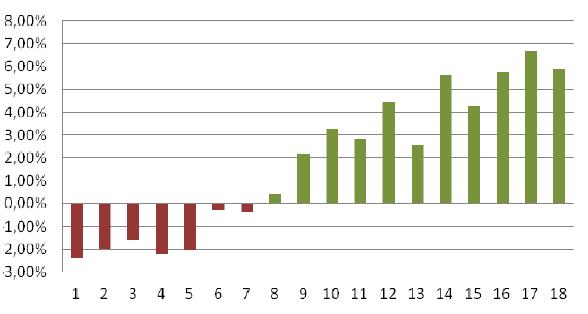
As shown in the graph consisting of the real values since the beginning of the last century, it is obvious that in the first seven years of the bear cycle, investors were not rescued by ongoing investments in the fifteen-year period of time. Specifically, if an investor had entered the market, for example in the years 1965-1972, and had regularly invested in a stock index, he ended his effort after fifteen years, including the inflation loss ranging from 0.25% p.a. to 2.32% per annum.
In the following years of the bear cycle, a continuous investment was a useful tool and the investment ended despite inflation in profit. Profits began to be attractive especially since the twelfth year of the cycle (1976), after fifteen years of appreciation by more than four percent. When counting two percent inflation we can talk about more than six per cent annual appreciation of the paid in capital.
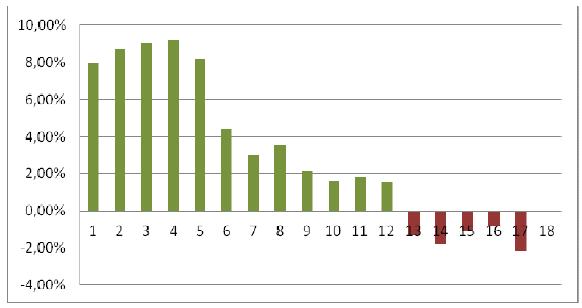
Conversely, if the investor waited to start with the investment until the bull cycle, he created conditions more favorable. However, even this has its furtiveness! Interesting values of four per cent per annum (or 6% with inflation) can the investor reach probably only during the first six years of a fifteen-year horizon. Profitable and inflation covering are also the next six years of bull cycle, but yield below two percent a year will not probably be interesting enough.
Figure 3: Return on continuous investment for 15 years with the beginning in the bull cycle
The best time to start with the continuous investment with 15-year horizon can we derive upon17.6 year cycle from figure number four. It is located between the twelfth year of the bear cycle and sixth year bull cycle. Specifically, if the bull cycle started in 1947, the best period to begin fifteen-year continuous investment in shares was 1941-1953. For the 1982 cycle, the most advantageous period seems 1976-1988. If the period of 17.6 years is still valid, the appropriate time for initiating the periodic fifteen years of investment may be (with the beginning of the bear cycle in 2000) the present, 2012-2013.
Does the investor have to wait for the initiation of the continuous investment only until a designated time period? Not necessarily. Just tinker with the investment horizon. The next figure shows the development of investment horizon of five, ten and fifteen years.
Figure 4: Return on continuous investment horizons 5, 10 and 15 (associated with bull and bear cycles)
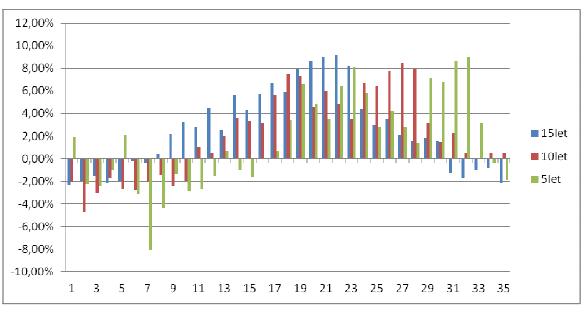
It is clear that in the early years of a bear cycle, the performance of all these horizons is poor. Interesting things happen in the following years. Firstly, a time for longer, fifteen-year investment horizon comes. It means after a period of twelve years after the outbreak of a bear cycle. Above-average performance of this horizon takes approximately another twelve years. If we consider the cycle of 1982, we talk about period 1976 - 1988. Then, as illustrated in the figure, the efficiency of 10-year cycle gains advantages. It takes another four years and based on historical data, the most powerful change of the investment horizon could be done just between 1988 and 1991. The next four years were short in terms of performance. So the „continuous investors“ could earn almost eight percent in appreciation between 1991-1995.
Reducing of investment horizon hang together with an increase in risk of its failure and it is true even for continuous investment. Even here, however, the history of the last century offers a weapon. At the end of the bull cycle, investors are generally put at the risk of a proper bubble. Whether in Internet or in the housing market or anywhere else. Period just before the bubble is characterized by unnaturally strong stock market growth and this also reflects in the return on continuous investments and sends a warning light. At the time when the average annual appreciation of investment gets into double-digit numbers, it is time to consider leaving and choose what the growth offered to us. Absolutely critical are values over 13 percent per year. If you have them in your account, then quickly away!
We are aware that one century is not in the light of a relatively long term cycle sufficient sample for testing the whole research at a sufficiently high level of significance, and its results do not have to be necessarily correct. However, as seen in the picture number one, the market cycle actually works and we can draw at least partial conclusions towards continuous investments.